Bitcoin pushes toward a major psychological level like $98,000, it’s never just a number on a chart. It’s a battleground where leverage, sentiment, liquidity, and macro expectations collide. The recent rejection near $98,000 has become a defining moment because it didn’t happen in isolation—it occurred after a strong run-up that attracted late buyers, aggressive long positioning, and the kind of “it only goes up” narrative that often appears near local peaks. Once price failed to hold the level, the market began to show something more important than a single red candle: Bitcoin started confirming a bearish structure.
A bearish structure doesn’t necessarily mean a full-blown crash is guaranteed. It means the market’s short-term behavior has shifted from “buy dips and trend higher” to “sell rallies and respect lower levels.” For traders, that change in character is the difference between quick recoveries and prolonged drawdowns. For investors, it signals that patience and risk management matter more than hype. In practical terms, the $98,000 rejection introduces a new question that dominates the next phase: where is the next area of high-probability support, and what is the next potential target if sellers stay in control?
In this article, we’ll break down what the $98,000 rejection is telling the market, how Bitcoin confirms a bearish market structure, what liquidity and order flow imply, and where the next potential target may sit if downside momentum continues. Along the way, you’ll see key support and resistance, technical analysis, trendline behavior, and on-chain signals woven into one coherent view—without forcing the narrative or over-optimizing the conclusion.
Understanding the Bearish Structure After the $98,000 Rejection
A rejection at a major level becomes meaningful when it changes structure. In classic price action terms, structure is simply the market’s pattern of higher highs, higher lows, lower highs, and lower lows. When Bitcoin repeatedly fails to reclaim a key zone and begins putting in lower highs while breaking prior support, it shifts from bullish to bearish.
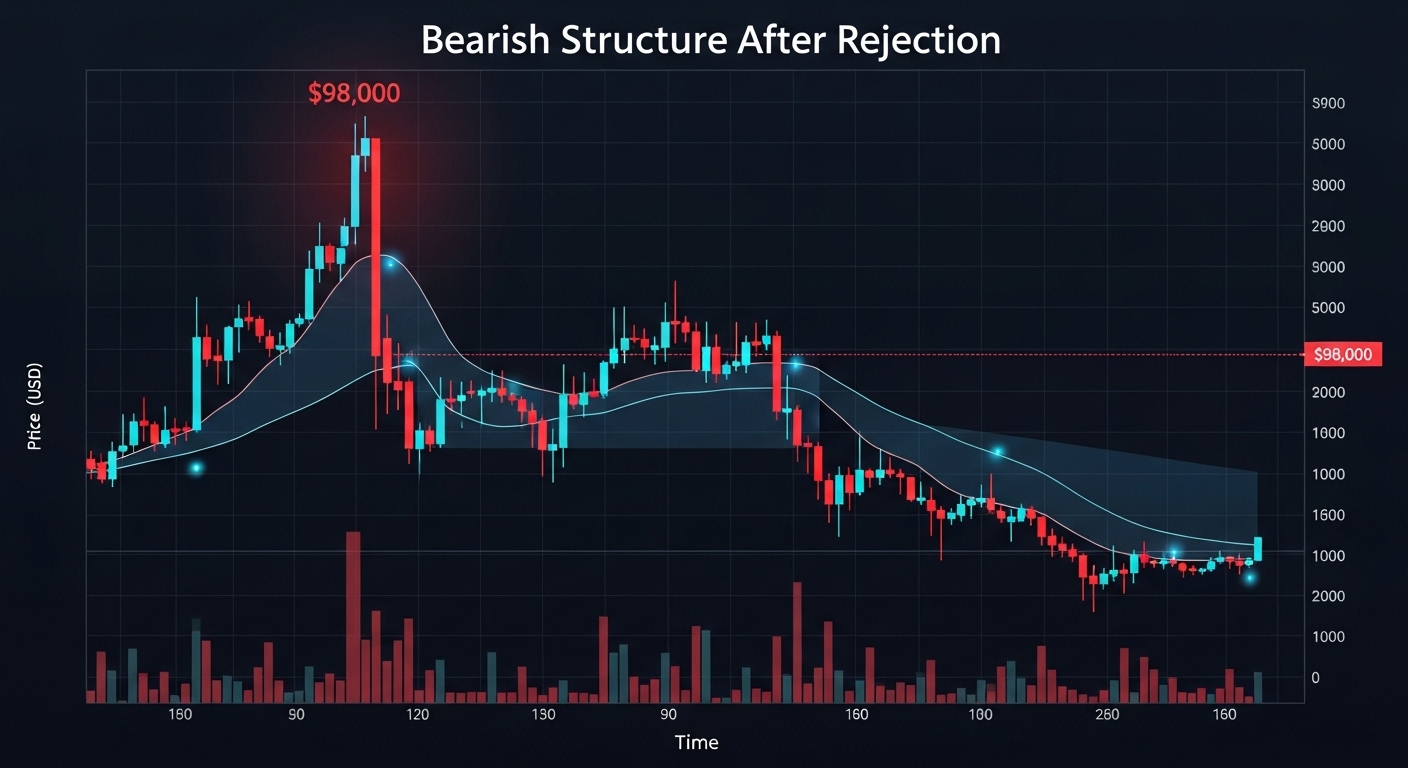
The $98,000 rejection matters because it’s a high-visibility level that likely contained clustered sell orders, profit-taking, and short entries. Once Bitcoin was rejected, the market needed to quickly reclaim the area to keep the bullish narrative intact. Instead, the follow-through was weak, and price began to respect lower areas. That’s often the earliest sign that rallies are being sold rather than bought.
What “Bearish Structure” Really Means in Price Action
A bearish structure typically shows up as a sequence of lower highs and lower lows. In real markets, it’s rarely perfect. Sometimes Bitcoin will chop sideways, form complex consolidations, or temporarily spike upward to hunt liquidity. But the defining feature remains: sellers control the swing points. When rallies fail to break prior highs and pullbacks break prior lows, the market is telling you that downside risk is rising.
This shift is especially important after a major rejection because it changes trader behavior. In a bullish regime, market participants view dips as opportunities. In a bearish regime, many start viewing rallies as exits. That’s why structure can be more informative than a single indicator: it reflects psychology.
Why $98,000 Became a Liquidity Wall
Round numbers attract attention, and attention attracts liquidity. Levels like $98,000 are magnets for stop orders, take-profit orders, and breakout trades. Bitcoin often tests these zones to “check” how much liquidity exists and how aggressively it can move through it. A rejection suggests supply overwhelmed demand at that point, at least temporarily.
A common pattern in crypto market cycles is that price pushes into a visible level, triggers breakout buys, then reverses as larger players sell into that surge. That doesn’t imply manipulation in a simplistic sense—it’s just how markets function when many participants place orders in similar places.
Key Technical Signals Confirming the Shift
After a major rejection, traders typically look for confirmation. Confirmation isn’t about predicting the future; it’s about validating that the market is behaving differently. For Bitcoin, several classic signals can combine to confirm a bearish turn: losing a prior support zone, rejecting from resistance on retests, and showing weakening momentum during rebounds.
Lower Highs and Lost Support: The Structure Checklist
One of the clearest confirmations comes when Bitcoin loses a prior support zone that previously acted as a springboard for the trend. Once that support breaks, the next critical event is the retest. If price rallies back up, touches the broken level, and fails again, that prior support often flips into resistance. That flip is the structural hallmark of a bearish transition.
If Bitcoin keeps printing lower highs during these retests, it suggests sellers are stepping in earlier each time, reducing the market’s ability to climb. That’s the sort of “invisible pressure” that can persist until a stronger demand zone is reached.
Moving Averages and Trendline Pressure
Although structure is the core, many traders also monitor dynamic levels like major moving averages. When Bitcoin trades below commonly watched averages and those averages begin to slope down, they can act like a ceiling. Add a descending trendline connecting recent lower highs, and you get a map of where sellers may defend.
This matters because technical analysis becomes a self-reinforcing feedback loop when many market participants track similar levels. The more traders see a downtrend line and fading rallies, the more they position defensively, which can keep Bitcoin under pressure.
Momentum and Volume: What Weak Bounces Reveal
In bearish phases, bounces often look “lazy.” Price moves up, but it lacks aggressive volume or strong follow-through. Momentum indicators are not perfect, but the concept behind them is useful: if Bitcoin can’t accelerate on rallies, it suggests buyers lack conviction.
Volume behavior can also be revealing. Heavy selling volume on drops combined with lighter volume on bounces often signals distribution rather than accumulation. It’s not a guarantee of more downside, but it increases the probability that sellers remain the dominant force until Bitcoin reaches a deeper support zone.
The Next Potential Target: Where Bitcoin Could Be Headed
Pinpointing a single exact target is unrealistic, especially in a volatile asset like Bitcoin. A better approach is to identify “zones” where buyers are more likely to appear: prior consolidation areas, major psychological levels, and regions that historically triggered strong reactions. The next potential target is often the nearest area where demand previously proved itself.
In many cases, after a rejection near a major high, Bitcoin revisits the last meaningful base it formed before the breakout attempt. That base is where earlier buyers defended price, and it often becomes the first “real test” after a structural break.
High-Probability Support Zones Based on Market Structure
A practical way to estimate the next potential target is to look for the most recent swing low that defined the bullish leg. If Bitcoin breaks below that low and fails to reclaim it, the market often seeks the next lower demand zone—usually an area of prior consolidation where price spent time building liquidity.
Those zones matter because they contain memory. Traders remember them. Algorithms reference them. And order books tend to thicken around them. When Bitcoin moves fast, it often moves toward areas where it previously paused.
The Role of Psychological Levels in Bitcoin’s Pullbacks
Psychological numbers like $95,000, $90,000, and $85,000 can influence short-term flow because humans anchor to them. Even if you don’t trade those levels, others do. This doesn’t mean Bitcoin must hit every round number, but it does mean those zones can create temporary support, relief rallies, or volatile whipsaws.
When bearish structure is confirmed, it’s common for Bitcoin to overshoot support briefly, then rebound sharply. That’s why zones are more useful than pinpoint targets: the market rarely respects a single perfect line.
Fibonacci Retracement and Mean-Reversion Logic
Many traders also use retracement tools to estimate where Bitcoin might stabilize. Without forcing a rigid framework, the underlying concept is mean reversion: after an extended run, price often retraces a meaningful portion of the prior move. If the rally into $98,000 was strong, a deeper pullback becomes statistically plausible once structure flips bearish.
This doesn’t mean a collapse is inevitable. It means that after rejection, the market may need time and lower prices to rebuild demand. In that scenario, the next potential target is often the region where longer-term buyers begin to re-enter with size.
Liquidity, Order Flow, and Why Volatility Can Spike
Bitcoin is a liquidity-driven market. Price moves to where orders are, and it accelerates when liquidity thins. After a major rejection like $98,000, liquidity dynamics often intensify. Traders who bought late place stops below obvious levels. Shorts place stops above recent highs. Market makers and larger participants position around these clusters.
The result is that Bitcoin can produce sudden spikes down (stop runs) and sharp bounces (short squeezes) even within an overall bearish structure. Understanding this helps you avoid emotional decisions based on a single candle.
Liquidation Cascades in Crypto Markets
Because crypto markets often include high leverage, breaks of obvious support can trigger liquidations. When long positions are forced to close, they effectively become market sells, adding fuel to the drop. This is one reason Bitcoin sometimes falls faster than traditional assets during bearish stretches.

After the $98,000 rejection, if Bitcoin continues to break lower supports, liquidation risk can increase. That doesn’t guarantee disaster, but it does explain why pullbacks can become sharp and why “it bounced last time” can be a dangerous assumption.
Fair Value Gaps and Inefficient Moves
When Bitcoin moves quickly, it can leave behind zones where trading was thin. Traders sometimes call these fair value gaps or inefficiencies. Price often revisits such zones later, not because it must, but because markets tend to fill areas where liquidity was skipped.
If the move away from $98,000 happened quickly, it may have created pockets of thin liquidity both above and below. That means future rallies and drops can be fast, especially around obvious levels where stop orders cluster.
On-Chain and Macro Context: What Could Reinforce the Bearish Case
Technical structure is powerful on its own, but context matters. Bitcoin responds to macro conditions like interest rate expectations, risk appetite, and U.S. dollar strength. It also reacts to internal network and positioning signals visible through on-chain analysis. When these align with bearish structure, downside targets become more plausible.
On-Chain Signals: Distribution vs Accumulation
On-chain data can help frame whether sell pressure is likely to persist. When long-term holders accumulate, pullbacks often get absorbed quickly. When distribution increases—meaning more coins move to exchanges or sell-side behavior rises—rallies can struggle.
No single on-chain metric should be treated as a magic predictor. But if multiple signals suggest rising sell pressure while Bitcoin confirms a bearish structure, it strengthens the case that the next potential target could be lower than traders initially expect.
Macro Risk: Rates, Dollar Strength, and Risk Assets
In risk-off environments, Bitcoin often behaves like a high-beta risk asset. If broader markets turn cautious, liquidity can tighten, and speculative assets may underperform. That backdrop can amplify bearish technical signals.
If macro conditions are neutral or improving, Bitcoin might stabilize faster. But when macro uncertainty rises, bearish structures can persist longer because fewer buyers are willing to step in aggressively until volatility cools.
Scenarios to Watch Next: Bearish Continuation vs Recovery
A bearish structure doesn’t lock the market into a single destiny. The smartest way to approach Bitcoin after a $98,000 rejection is to map scenarios. What would continuation look like? What would recovery require? Instead of predicting, you prepare.
Scenario 1: Bearish Continuation Toward Deeper Support
In a continuation scenario, Bitcoin keeps making lower highs, loses intermediate support zones, and drifts toward the next major demand region. Relief rallies happen, but they fail at prior resistance flips. In this environment, the next potential target becomes the area where buyers previously defended with conviction—typically a prior consolidation zone or a psychologically important round level.
This scenario often includes volatility spikes, quick bounces, and false breakouts. The key is that structure stays intact: lower highs remain unbroken.
Scenario 2: Range Formation Before a Bigger Decision
Sometimes Bitcoin doesn’t immediately collapse or recover. It ranges. After a rejection like $98,000, the market can spend time building a sideways base, shaking out both longs and shorts. Ranges can be frustrating because they create multiple fake signals, but they often precede a bigger move.
If Bitcoin forms a range, traders may watch for reclaiming key levels on strong volume as a sign that bearish pressure is fading.
Scenario 3: Bullish Reclaim That Invalidates the Bearish Structure
The bearish thesis weakens if Bitcoin reclaims the broken resistance zone and starts printing higher highs again. A strong reclaim typically includes acceptance above key levels, not just a brief wick. If price can hold above prior breakdown areas and turn them into support, it signals demand is back in control.

This is why structure is so useful: it defines invalidation. Rather than arguing with the market, you let Bitcoin prove whether the bearish structure remains valid.
Risk Management: How to Think Clearly in a Bearish Structure
Whether you trade or invest, bearish structure is a reminder that risk matters. Volatility can punish emotional entries, and chasing rebounds in Bitcoin can be expensive if sellers remain dominant. The goal isn’t to be bearish or bullish—it’s to be prepared.
A disciplined approach focuses on levels, confirmations, and position sizing. If Bitcoin is below key resistance, you assume rallies can fail. If it reclaims structure, you adapt. Flexibility beats conviction in fast markets.
Conclusion
The $98,000 rejection is significant because it helped Bitcoin confirm a bearish structure, shifting the market from momentum-driven optimism to level-driven caution. While that doesn’t guarantee a collapse, it does raise the odds of further downside probing—especially if rallies continue to fail and broken support zones keep flipping into resistance. The next potential target is best viewed as a support zone rather than a single number: an area where prior demand, psychological levels, and liquidity clusters can converge to slow the move and potentially spark a stronger reaction.
For now, the market’s message is simple: Bitcoin must either reclaim key levels to invalidate the bearish structure or accept that sellers control the swing points until deeper support attracts enough demand. If you stay focused on structure, liquidity, and confirmation, you’ll read the market more clearly—without getting trapped by noise.
FAQs
Q: Does a bearish structure mean Bitcoin will crash?
Not necessarily. A bearish structure means the short-term trend is biased downward through lower highs and broken supports. Bitcoin can still range, bounce sharply, or reclaim levels. It’s a probability shift, not a guarantee.
Q: Why is the $98,000 rejection such a big deal?
Because $98,000 is a high-visibility level that likely contained heavy liquidity. When Bitcoin fails at a major psychological zone and follows through with weaker structure, it often signals a shift from buying pressure to selling pressure.
Q: What is the “next potential target” after a rejection?
The next potential target is typically the nearest high-probability demand zone, often a prior consolidation area or major psychological level where buyers previously stepped in. For Bitcoin, targets are best treated as zones because volatility can overshoot.
Q: Can Bitcoin quickly turn bullish again after confirming bearish structure?
Yes. If Bitcoin reclaims key resistance levels, holds them as support, and starts printing higher highs, it can invalidate the bearish structure. Strong volume and acceptance above prior breakdown zones are often watched as confirmation.
Q: What should traders watch most in this phase?
Traders often focus on support and resistance, whether broken support flips into resistance, the formation of lower highs, and liquidity-driven volatility events like stop runs. These clues help determine whether Bitcoin is continuing bearish momentum or transitioning into a base.
See More: US Government Bitcoin Faces Risk After Insider Theft Claims