
Bitcoin the world’s first and most widely known cryptocurrency. has been through many twists and turns since its inception in 2009. Despite the volatile nature. Crypto markets, Bitcoin has maintained its position as the market leader, setting the tone for other digital assets. But after reaching new highs, followed by periods of consolidation, Bitcoin’s price is once again at a crossroads.
The Current Bitcoin Market Landscape
Before diving into technical analysis, it’s important to first look at the bigger picture of Bitcoin’s recent market performance. Over the past year, Bitcoin has experienced significant price fluctuations, with dramatic rises and sharp corrections. As of now, Bitcoin is hovering near key support and resistance levels, with many analysts predicting that the market is nearing a critical decision point.
On one hand, there’s the potential for a bullish breakout, with Bitcoin’s long-term trend remaining intact. On the other hand, Bitcoin could face a breakdown, where the price could fall back to lower support zones. Understanding these price movements is crucial to anticipating BTC’s next major move.
Bitcoin Price Chart Analysis
Support and Resistance Zones
Bitcoin’s price action over the past several months has created clear support and resistance levels that traders are closely monitoring. These levels represent price points where Bitcoin has either bounced (support) or faced rejection (resistance).
Support levels are critical because they indicate areas where demand is strong enough to prevent further price declines. If Bitcoin approaches a support level and shows signs of reversal, it could be a sign that the market is ready for a breakout. Conversely, if Bitcoin breaks below these support levels, it could signal the beginning of a breakdown.
Moving Averages
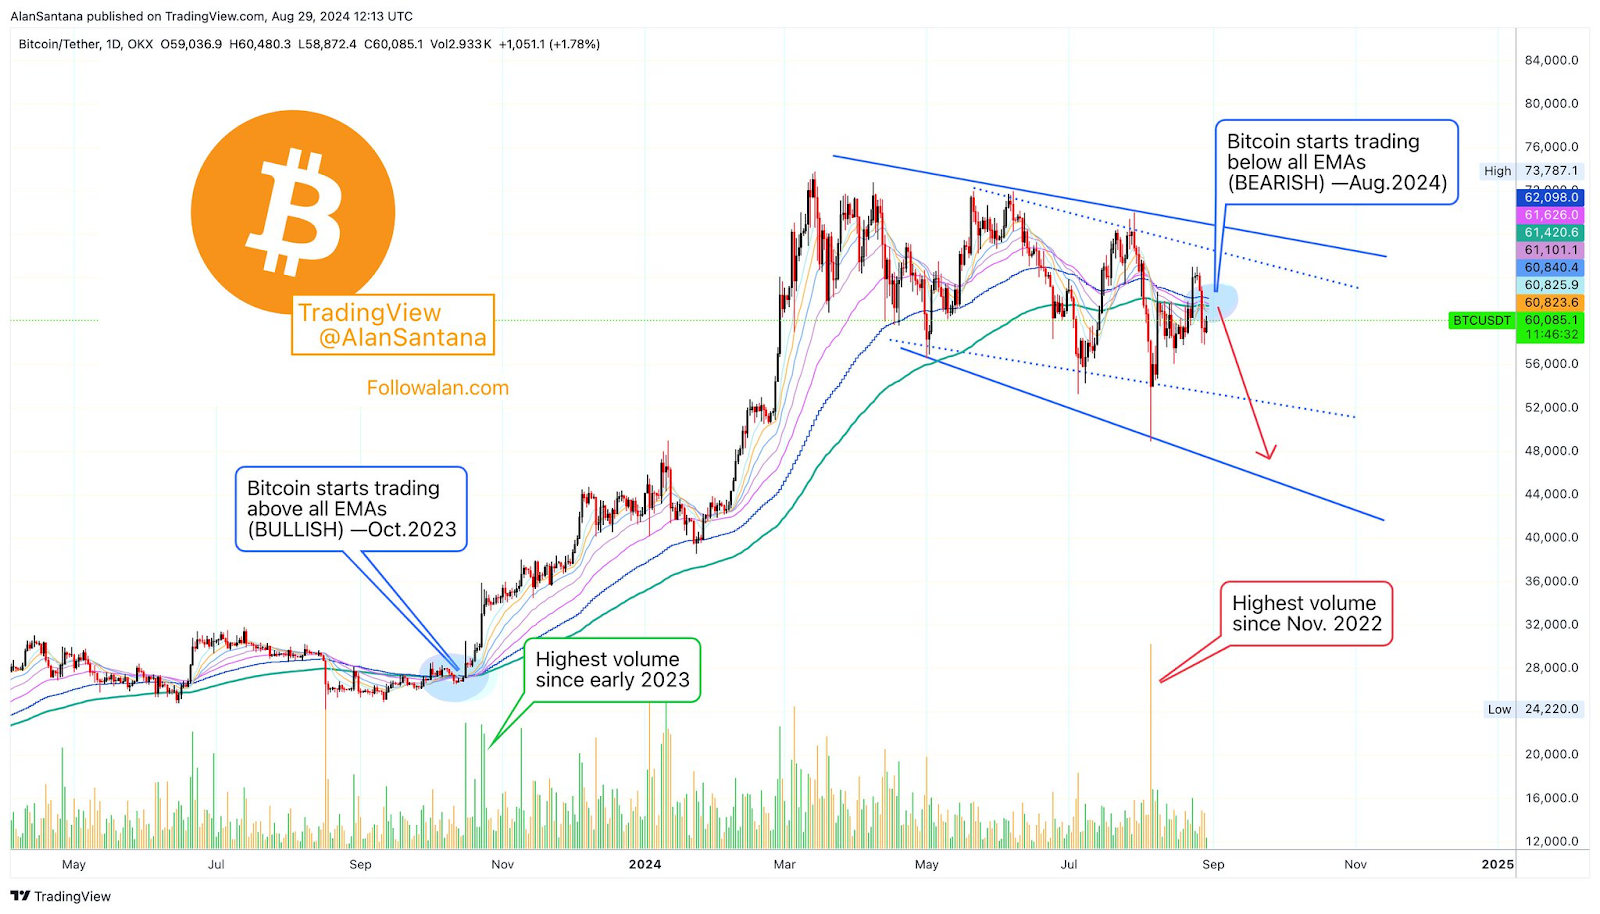
Moving averages are powerful technical indicators that help smooth out price action and reveal the broader trend. The 50-day and 200-day moving averages are often used by traders to identify key trend reversals.Currently, Bitcoin’s 50-day moving average is trending above its 200-day moving average.
Traders are closely watching the intersection of these moving averages to determine the next major move. If Bitcoin’s price consolidates above both the 50-day and 200-day moving averages, a breakout is more likely. But if the price falls below both, the bearish sentiment could accelerate, triggering a sharp decline.
Relative Strength Index
The Relative Strength Index is another essential tool for gauging whether Bitcoin is overbought or oversold. The RSI measures the magnitude of recent price changes to evaluate whether an asset is potentially overbought or oversold, which can signal a reversal.Currently, Bitcoin’s RSI is hovering.
If Bitcoin’s RSI continues to rise and reaches the 70 mark, it could indicate that the market is getting overheated and a correction could be imminent. On the other hand, if the RSI begins to fall from current levels, it could suggest that Bitcoin is losing momentum, signaling a potential breakdown.
What’s Fueling Bitcoin’s Price Movements?

Beyond technical analysis, several fundamental factors are contributing to Bitcoin’s price action. These include global economic conditions, institutional adoption, and regulatory developments.
Institutional Adoption and Bitcoin as Digital Gold
Over the past few years, institutional interest in Bitcoin has surged. Major financial institutions like MicroStrategy, Tesla, and Square have made significant Bitcoin purchases, seeing it as a store of value similar to gold. This institutional demand has provided significant support for Bitcoin’s price and has been a key factor in driving the bullish rally we’ve seen in recent months.
If institutional investors continue to view Bitcoin as a hedge against inflation and a store of value, it could lead to further price increases, contributing to a breakout scenario. However, any negative developments, such as a large-scale sell-off by institutional investors, could trigger a breakdown.
Regulatory Scrutiny and Market Sentiment
One of the most significant risks to Bitcoin’s price is regulation. While countries like El Salvador have embraced Bitcoin, others like China have cracked down on cryptocurrency mining and trading. Any regulatory changes or crackdowns, particularly in key markets like the United States or Europe, could severely impact Bitcoin’s price.
For example, if the U.S. Securities and Exchange Commission decides to impose stricter regulations on Bitcoin or other cryptocurrencies, it could lead to a decline in market sentiment and a potential price breakdown. Conversely, positive regulatory news, such as the approval of a Bitcoin ETF, could send Bitcoin’s price soaring, contributing to a bullish breakout.
Global Macroeconomic Conditions
Global macroeconomic factors such as inflation, interest rates, and geopolitical tensions also play a significant role in Bitcoin’s price movements. For instance, concerns about inflation and currency devaluation have led many to view Bitcoin as a safe haven, driving demand and pushing prices higher. On the other hand, if global economic conditions stabilize and investors shift their focus to traditional assets, Bitcoin could face a price correction.
Conclusion
The coming weeks will likely determine. Bitcoin will break out to new highs or face a breakdown back to lower levels. Traders and investors need to stay vigilant and monitor key technical indicators such as moving averages, RSI, and support/resistance zones to gauge the direction of Bitcoin’s next big move.
Whether Bitcoin breaks out or breaks down will depend on a confluence of factors, including institutional demand, regulatory developments, and market sentiment. As always, it’s essential for investors to stay informed and be ready to adapt to changing market conditions.