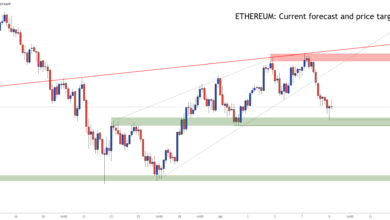
Ethereum is back in the part of the chart where emotions change faster than price. One clean push upward can flip the mood from cautious to euphoric, while one sharp rejection can turn “inevitable breakout” into “why is it dumping?” That’s exactly why Ethereum price analysis matters right now. ETH is approaching a major roadblock—a thick resistance area where sellers have historically defended their ground and where buyers must prove they have enough conviction to keep the rally alive.
This stage of Ethereum price analysis is especially important because the market is staring at a simple, powerful narrative: the road to $4,000. Round-number targets like $4K tend to attract attention from traders, investors, and media alike. But price does not rise on attention alone. It rises when demand overwhelms supply, when liquidity shifts, and when a key level flips from resistance into support. If ETH can clear the roadblock ahead, the path to $4K becomes much less theoretical. If it cannot, the market may need more consolidation before another attempt.
In this Ethereum price analysis, you’ll get a clear, detailed breakdown of the resistance zone ETH is fighting, the support levels that must hold to keep the bullish structure intact, and the technical and fundamental catalysts that could push Ethereum toward $4K. You’ll also see how to think in scenarios instead of predictions—because the most useful Ethereum price analysis is the kind that helps you stay calm and rational while the market tries to make you do the opposite.
Ethereum Price Analysis: Why This Roadblock Matters More Than a Number
The reason this roadblock is so critical in Ethereum price analysis is that it represents a concentration of past trading activity. The more time price has spent around a region historically, the more “memory” the market has there. Traders who bought near that area and held through drawdowns may be eager to sell when price returns. Traders who shorted successfully in that zone may try again. And traders who missed earlier entries may wait for confirmation before committing capital.
This is why Ethereum price analysis often emphasizes zones rather than a single magic number. A resistance band can contain several overlapping forces: previous swing highs, psychological levels, and areas where large amounts of ETH changed hands. When ETH approaches such a cluster, volatility tends to rise and the market becomes sensitive to headlines, leverage, and sudden bursts of volume.
The “major roadblock” in this Ethereum price analysis is not just a technical obstacle. It’s also a test of market identity. If ETH breaks through, the story becomes about continuation and momentum. If it fails, the story becomes about patience and structure. Either way, this is a moment where Ethereum’s next direction can become clearer than it has been during quieter consolidation.
Ethereum Price Analysis and Market Psychology at Major Levels
Market psychology is the invisible engine behind many chart patterns, and Ethereum price analysis is basically the study of that engine through price behavior. When ETH nears a widely watched resistance zone, three groups become active at once. First are the profit-takers who want to lock gains before a potential rejection. Second are breakout buyers who believe momentum will accelerate once the level breaks. Third are sellers who treat the zone as a high-probability area to fade.
When these groups collide, the result is usually choppy. That choppiness is not random; it’s negotiation. In Ethereum price analysis, negotiation phases often look like tight ranges, repeated wicks, and quick reversals. The market is probing for weakness. If buyers keep defending pullbacks and pushing back into resistance, supply can get absorbed. If sellers repeatedly push ETH down with conviction, buyers can get discouraged.
This is why it’s risky to treat resistance as either “definitely breaks” or “definitely rejects.” Better Ethereum price analysis reads the behavior at the level: how price reacts, how quickly it recovers, and whether dips are bought with increasing strength.
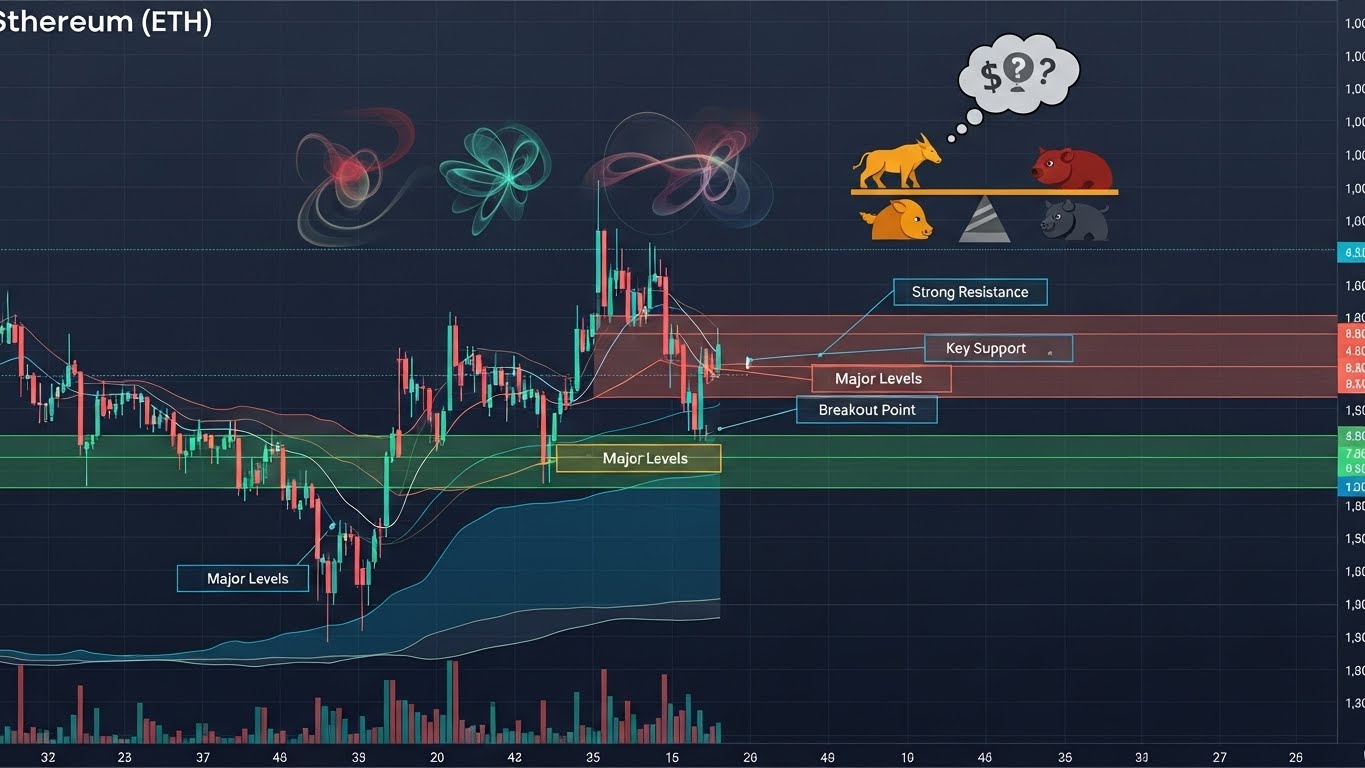
Ethereum Price Analysis: Key Resistance Zones Between ETH and $4K
At the heart of this Ethereum price analysis is the overhead resistance. Think of resistance as a ceiling built from old decisions. The market remembers where people bought, where they sold, and where they got trapped. When ETH rises back into that region, those memories become orders. That’s the roadblock.
A typical resistance cluster on the way to $4K often includes a near-term ceiling that stalls price, followed by a higher “final boss” level that forces one last wave of selling. In Ethereum price analysis, the strongest breakouts usually come after ETH has tested resistance multiple times without collapsing, because each test can reduce the remaining supply available to sell.
The First Barrier: The Immediate Resistance Shelf
In this Ethereum price analysis, the first barrier is the immediate resistance shelf where ETH has recently hesitated. This level matters because it functions like a short-term gatekeeper. If ETH can reclaim it and hold above it, it changes the feel of the market. Buyers become more confident in dips, and sellers lose the ability to push price down easily.
From a technical perspective, this shelf often aligns with a prior range top. Range tops are notorious in Ethereum price analysis because they can act like a magnet that repeatedly rejects price until the market accumulates enough strength. If ETH fails here, price often revisits support quickly. If ETH holds, the next resistance zone becomes the main focus.
The Major Roadblock: The Heavy Supply Zone
The heavy supply zone is the “major roadblock” referenced in this Ethereum price analysis title. This is typically where ETH has printed notable swing highs in the past and where a lot of traders expect a reaction. When ETH enters this zone, you may see liquidity spikes, sudden volatility, and aggressive two-sided trading.
A strong clue in Ethereum price analysis is whether ETH can accept above the zone. Acceptance is different from a brief poke above resistance. Acceptance looks like sustained trading above the level, with pullbacks that find buyers quickly rather than collapsing. If acceptance happens, the market often shifts from “sell rallies” to “buy dips,” and that behavioral change is what can drive ETH toward $4K.
The Psychological Magnet: Why $4K Pulls Price in Ethereum Price Analysis
The $4,000 level matters in Ethereum price analysis because it’s a psychological marker. People talk about it. Traders set orders around it. Options markets often cluster activity near it. Even long-term holders anchor expectations to it. This can create a self-reinforcing effect where price accelerates toward the level once momentum is established.
However, Ethereum price analysis also warns that psychological levels can trigger intense profit-taking. Even if ETH reaches $4K, it may not slice through immediately. The market often “checks” these levels by pulling back, retesting, and then deciding whether continuation is justified.
Ethereum Price Analysis: Support Levels That Keep the Bullish Structure Alive
Resistance gets the headlines, but support determines whether bulls stay in control. A complete Ethereum price analysis must map the downside as carefully as the upside. If ETH gets rejected at the roadblock, where do buyers step in? If support breaks, how deep can the pullback go without destroying the trend?
Support levels are not just technical lines; they are zones where buyers historically decided, “this is cheap enough.” In Ethereum price analysis, the best support zones tend to be areas where price consolidated before moving higher, because they reflect prior accumulation.
The Near-Term Support: Where Dips Must Be Bought Quickly
Near-term support acts like a shock absorber. In this Ethereum price analysis, this is the area that should hold if ETH is truly strong. When ETH is in bullish mode, pullbacks tend to be shallow and fast. Buyers don’t wait for perfect entries; they buy earlier because they fear missing the next push higher.
If ETH drops to near-term support and bounces with force, it’s a sign of bullish momentum. If ETH breaks below near-term support and struggles to reclaim it, the market may be telling you the roadblock is working and buyers need time to rebuild.
The Structural Support: The Level That Defines the Trend
Structural support is the line that defines whether the bullish trend is still intact. In Ethereum price analysis, this often aligns with a prior swing low, a higher low, or a multi-week base. If ETH holds structural support, the bull case remains alive even after a rejection. If ETH loses structural support, the market can shift from “breakout attempt” to “deeper correction.”
This is why Ethereum price analysis is often about process. One rejection does not destroy a trend. Repeated rejections combined with broken support can, especially if selling is accompanied by rising volume and weakening recovery attempts.
The Range Floor: What Happens If ETH Falls Back Into Consolidation
If ETH loses key supports, the market may fall back into a broader consolidation range. In Ethereum price analysis, ranges are where the market resets. They can be frustrating, but they also build foundations for larger moves. A return to the range floor would shift the focus from “ETH to $4K soon” to “ETH needs to build again.”
This scenario is not automatically bearish long term. It simply means the roadblock did its job and the market needs more time. Strong markets often revisit key supports without breaking them. The signal comes from how ETH behaves on the bounce: does it reclaim levels with confidence, or does it struggle?
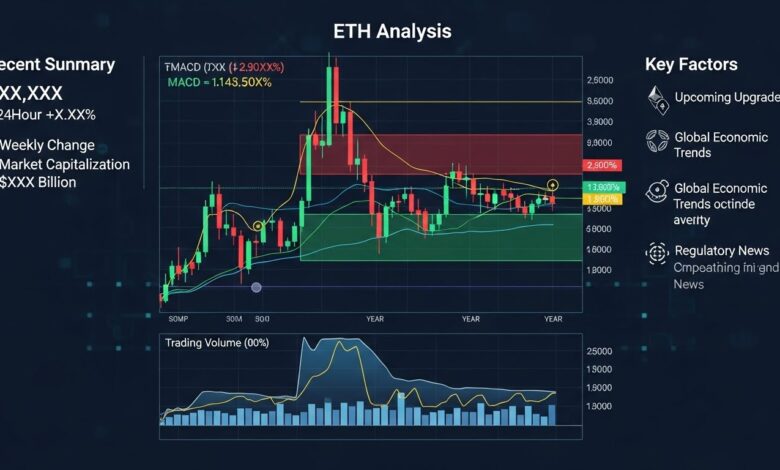
Ethereum Price Analysis: What the Indicators Say About Momentum
Indicators are not magical predictors, but they can help confirm what price is already implying. Good Ethereum price analysis uses indicators as supporting evidence, not as the main argument. If price is pressing resistance and indicators show momentum fading, that suggests caution. If price is pressing resistance and indicators show momentum building, that supports a breakout narrative.
RSI in Ethereum Price Analysis: Overbought vs. Strong Trend
The RSI can be misunderstood. In many strong uptrends, RSI stays elevated for longer than people expect. In Ethereum price analysis, “overbought” does not mean “must crash.” It can mean “trend is strong.” The more useful question is whether RSI is making higher highs alongside price. If RSI diverges downward while price pushes higher, that can signal weakening momentum and increase the odds of rejection.
In this roadblock phase, RSI behavior can help interpret whether ETH is pushing with real strength or merely floating upward on thin demand.
MACD and Trend Continuation Signals
The MACD is often used to spot trend shifts and momentum swings. In Ethereum price analysis, a positive MACD structure can support the idea that pullbacks are temporary and continuation is likely. If MACD begins to roll over while ETH is at resistance, it can suggest momentum is cooling and that sellers may defend the roadblock successfully.
Indicators like MACD become most valuable when they align with key price levels. A bearish indicator shift at resistance is more meaningful than the same shift in the middle of a random range.
Volume and Liquidity: The Confirmation Tools
If you want one confirmation tool that traders across styles respect, it’s volume. In Ethereum price analysis, breakouts supported by rising volume tend to be more reliable than breakouts that occur on low activity. Low-volume breakouts can be traps because they lack broad participation.
Liquidity matters too. If the market is thin, price can spike through resistance and reverse quickly. If liquidity is healthy and buy pressure is sustained, ETH has a better chance to break and hold above the roadblock.
Ethereum Price Analysis: Fundamentals That Can Support a Move Toward $4K

Ethereum is not just a chart. It’s an ecosystem that includes DeFi, Layer 2 networks, staking, and a constant stream of innovation. While short-term moves can be driven by speculation, longer-term direction often tracks adoption, activity, and narrative strength. A complete Ethereum price analysis includes fundamentals because they influence investor conviction.
Staking and Supply Dynamics in Ethereum Price Analysis
Staking reduces liquid supply by locking ETH in validator systems. In Ethereum price analysis, reduced liquid supply can amplify price moves when demand rises because fewer coins are available to sell. If demand spikes during a breakout, constrained supply can accelerate the push upward.
Staking also affects psychology. Many long-term participants treat staked ETH as a long-term position, which can reduce panic selling during volatility and support stronger bases.
Gas Fees, Network Demand, and the “Real Usage” Signal
Gas fees are not fun to pay, but they can signal demand. Rising usage often increases fees, especially during major market moves. In Ethereum price analysis, a growth in network demand can support the narrative that Ethereum isn’t pumping on hype alone—it’s being used.
That said, modern Layer 2 scaling can shift activity away from mainnet while still supporting Ethereum’s broader ecosystem. The key idea in Ethereum price analysis is whether overall activity is expanding, whether liquidity is healthy, and whether Ethereum remains the center of high-value on-chain finance.
DeFi and Institutional Narratives
DeFi remains one of Ethereum’s strongest long-term narratives. When markets turn risk-on, capital often rotates into on-chain yield, trading, and collateral systems. In Ethereum price analysis, that rotation can support ETH because Ethereum is the settlement layer and core asset behind much of the ecosystem.
Institutional interest, including exposure via regulated products and growing market infrastructure, can also support the demand side of the equation. If institutions increase participation during a breakout phase, it can provide the steady bid needed to sustain moves beyond resistance.
Ethereum Price Analysis: Bull Case vs. Bear Case Scenarios for the $4K Path
The most practical Ethereum price analysis is scenario-based. Instead of saying “ETH will do X,” you outline conditions. If conditions A and B happen, outcome X becomes likely. If conditions fail, outcome Y becomes more likely.
Bull Case: Breakout, Retest, Continuation Toward $4K
In the bull case, ETH breaks above the major roadblock with conviction. Ethereum price analysis would look for a sustained hold above resistance, not just a brief spike. Then comes the retest. Retests are where breakouts prove themselves. If ETH pulls back, taps the former resistance, and bounces, that’s the classic “resistance becomes support” signal.
Once that flip happens, Ethereum price analysis often shifts from “can it break?” to “how fast can it run?” That’s when momentum traders step in aggressively, and the market can begin pulling toward $4K as the next psychological target.
The bull case is strengthened if pullbacks remain shallow, if volume rises on pushes upward, and if the broader crypto market supports risk-taking.
Neutral Case: More Consolidation Before the Next Push
In the neutral case, ETH continues to chop near the roadblock. Ethereum price analysis would treat this as absorption rather than failure—provided support holds and each dip is met with buyers. This scenario can be frustrating, but it often precedes larger moves. The longer ETH consolidates under resistance without breaking down, the more likely it is that sellers are gradually being absorbed.
In this case, ETH can still reach $4K, but the journey is slower and requires patience. Breakouts from long consolidations can be powerful, but they rarely happen on a schedule.
Bear Case: Rejection Leads to Support Tests and a Reset
In the bear case, ETH rejects at the major roadblock and loses near-term support. Ethereum price analysis would then focus on structural support, and potentially a broader range floor if selling accelerates. This scenario doesn’t mean Ethereum is “done.” It means the market chose to reset rather than continue immediately.
Bear cases become more convincing if rebounds are weak, if sellers control rallies, and if ETH fails to reclaim broken levels. A deeper pullback can still be a healthy correction within a longer bull cycle, but it changes the timing and probability of the $4K target.
Ethereum Price Analysis: How to Read This Setup Without Overreacting
The hardest part of trading and investing is not technical knowledge; it’s emotional control. This is where Ethereum price analysis becomes a discipline rather than a hobby. When ETH is near a major roadblock, you’ll see dramatic opinions every day. Some will call for immediate $4K, others will call for a collapse. The market doesn’t care about either.
A calmer Ethereum price analysis approach focuses on three things: how ETH behaves at resistance, how it behaves on pullbacks, and whether the broader trend remains intact. If ETH is rejecting but not breaking support, that’s information. If ETH breaks resistance and holds it, that’s information. If ETH loses support and fails to reclaim it, that’s information.
The goal is not to predict perfectly; it’s to respond intelligently. Strong markets often test your patience before rewarding it. Weak markets often tempt you with hope before disappointing it. Ethereum price analysis helps you recognize which environment you’re in.
Conclusion
This Ethereum price analysis highlights a pivotal moment: ETH is nearing a major roadblock that could determine whether the market accelerates toward $4,000 or pauses for a longer consolidation. Resistance zones like this are where breakouts are born—or rejected. The bullish path requires a clean break above the roadblock, followed by acceptance and a successful retest that turns resistance into support. If that sequence plays out, the $4K target becomes far more realistic.
On the other hand, this Ethereum price analysis also makes clear that rejection is possible, and support levels matter just as much as upside targets. If ETH fails at resistance and loses key supports, the market may reset into a broader range before attempting another push. The best way to navigate this phase is to think in scenarios, watch confirmation signals like volume and bullish momentum, and let price behavior guide your expectations.
FAQs
Q: What is the “major roadblock” in this Ethereum price analysis?
In this Ethereum price analysis, the major roadblock refers to a heavy resistance zone where ETH has historically faced strong selling pressure. It’s a clustered area rather than a single price, and it’s where breakouts often need clear confirmation to succeed.
Q: What does ETH need to do to make a credible run to $4K?
A credible move in Ethereum price analysis typically requires a breakout above resistance, followed by sustained trading above that level. The strongest signal is when ETH retests the former resistance and holds it as support, confirming the breakout.
Q: If ETH gets rejected, what should I watch next?
If ETH is rejected, this Ethereum price analysis suggests watching nearby support levels and the strength of the bounce. A quick recovery supports the bull case, while weak rebounds and broken supports suggest a deeper reset.
Q: How important are indicators like RSI and MACD for ETH right now?
In Ethereum price analysis, indicators like RSI and MACD are helpful as confirmation tools. They matter most when they align with key price levels. Rising momentum into resistance supports a breakout narrative, while weakening momentum can hint at rejection risk.
Q: Can fundamentals like staking and Layer 2 growth influence ETH’s price trend?
Yes. In Ethereum price analysis, fundamentals such as staking, ecosystem growth, Layer 2 adoption, and real network demand can strengthen investor conviction and reduce liquid supply, which may support larger upside moves when demand increases.
Also Read: Ethereum $300 Crash or $9K Rally?