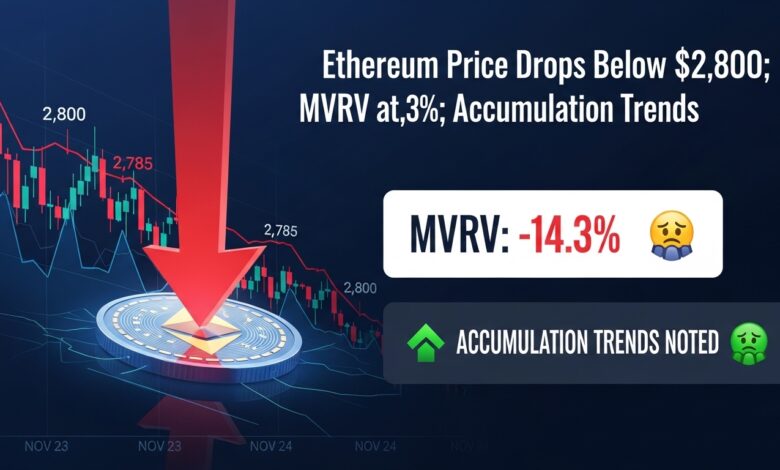
The cryptocurrency market continues to witness volatility, and Ethereum has recently become the focal point of investor attention. Ethereum’s price has slipped below $2,800, signaling a notable shift in market dynamics. Simultaneously, the Market Value to Realized Value (MVRV) ratio has plunged to -14.3%, indicating potential undervaluation and heightened accumulation activity among long-term holders. These trends suggest that while market sentiment appears cautious, there is growing interest from investors seizing lower price points to accumulate ETH.
Ethereum’s decline comes amid broader crypto market fluctuations, with macroeconomic factors such as interest rate expectations, inflation data, and global economic uncertainty influencing investor behavior. Despite the drop, blockchain analytics reveal accumulation trends that point to potential support levels forming in the near term. Understanding these key metrics and behavioral patterns is essential for traders, investors, and analysts who aim to navigate Ethereum’s market effectively.
This article explores Ethereum’s recent price decline, examines the implications of its MVRV ratio, and analyzes accumulation patterns. By delving into these aspects, we provide a comprehensive overview of Ethereum’s current positioning and potential trajectories.
Ethereum Price Decline: Context and Implications

Ethereum’s dip below $2,800 reflects broader market volatility that has impacted both altcoins and major cryptocurrencies. This decline is influenced by several factors, including market-wide sell-offs, speculative trading behavior, and macroeconomic pressures. Historically, Ethereum has shown resilience following sharp corrections, often stabilizing after reaching psychologically significant price thresholds.
The drop below $2,800 may also serve as a catalyst for renewed trader activity, where short-term traders capitalize on volatility while long-term investors assess accumulation opportunities. Price support at key levels becomes increasingly significant in determining potential rebounds or further declines.
Analysts note that Ethereum’s decline is not purely price-driven but also linked to on-chain activity and market sentiment. Blockchain metrics reveal increased wallet activity in the lower price range, suggesting that investors are strategically accumulating ETH in anticipation of future upward movement. This behavior underscores the dual nature of Ethereum’s market: high volatility coexists with long-term confidence in its fundamentals.
MVRV Ratio Analysis: Understanding Ethereum’s Market Value Relative to Realized Value
The MVRV ratio is a crucial on-chain metric that compares the market value of Ethereum to its realized value, which represents the average price at which all coins were last moved. An MVRV of -14.3% indicates that the current market value of Ethereum is 14.3% below the aggregate cost basis of existing ETH, signaling potential undervaluation.
Negative MVRV readings are often interpreted as a market bottom indicator, suggesting that holders are experiencing temporary losses, which may prompt opportunistic accumulation. Historically, Ethereum has shown patterns where prolonged negative MVRV values precede periods of consolidation and eventual price recovery. For investors, this metric provides a quantitative lens through which to gauge the market’s current sentiment relative to historical norms.
In the present scenario, an MVRV of -14.3% coincides with broader crypto market uncertainty. Investors assessing this metric alongside trading volumes, wallet inflows, and accumulation trends can better understand potential entry points and market resilience.
Accumulation Trends: Evidence of Investor Confidence
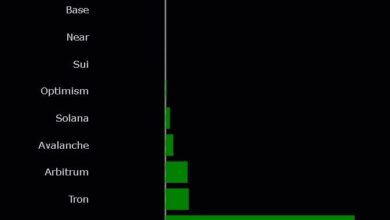
Despite the recent price drop, blockchain analytics reveal significant accumulation trends. Accumulation refers to the buying of Ethereum by investors at lower price points, often by long-term holders who anticipate future gains. Wallet data indicates increased activity in the $2,700–$2,900 range, highlighting a concentrated accumulation effort during the price dip.
Accumulation trends are often considered bullish indicators, as they suggest confidence in Ethereum’s long-term potential. When institutional investors or whale wallets participate in accumulation, it can exert upward pressure on the market once selling pressure subsides. Moreover, accumulation at lower price points strengthens support levels, reducing the likelihood of rapid downward spirals in subsequent trading sessions.
Market participants monitor these trends closely, as sustained accumulation may precede periods of price stabilization or a gradual upward trajectory. Combining accumulation data with MVRV insights provides a comprehensive understanding of Ethereum’s market health.
Market Sentiment and Behavioral Patterns
Ethereum’s current market sentiment is a mix of cautious optimism and opportunistic trading. On one hand, the price decline has triggered short-term concerns among retail traders, resulting in reduced leverage usage and a temporary slowdown in speculative activity. On the other hand, seasoned investors and institutions perceive the dip as an accumulation window, capitalizing on undervaluation indicators such as negative MVRV and historical support levels.
Behavioral patterns also reveal cyclical tendencies in Ethereum’s market. Price corrections often coincide with increased accumulation among long-term holders, which stabilizes the asset and sets the stage for future growth. Social sentiment analysis, news flow, and transaction metrics contribute to understanding these behavioral dynamics, offering insights into potential price movements.
Technical Indicators and Support Levels

From a technical perspective, Ethereum’s dip below $2,800 situates it near historical support levels identified in previous market cycles. Key moving averages, Fibonacci retracement levels, and volume-weighted support zones indicate that the asset is approaching a price range where buying interest historically increases.
Monitoring technical indicators alongside on-chain metrics enhances decision-making for traders and investors. For example, increased buying activity at these support levels may signal an imminent rebound, whereas failure to hold support could trigger additional short-term declines. Combining technical and fundamental insights provides a more holistic understanding of Ethereum’s market dynamics.
Macroeconomic Influences
Global macroeconomic factors continue to influence Ethereum’s price movement. Interest rate announcements, inflation data, and broader financial market volatility can indirectly impact crypto assets. In periods of macroeconomic uncertainty, investors often reassess their exposure to risk assets, including Ethereum.
Furthermore, correlations between Ethereum and major market indices or other cryptocurrencies can exacerbate price movements. Understanding these macroeconomic interdependencies helps investors anticipate potential fluctuations and adjust portfolio strategies accordingly.
Long-Term Outlook and Investment Implications
Despite the current price drop, Ethereum’s long-term outlook remains grounded in its technological advancements, decentralized finance adoption, and network upgrades. Initiatives such as Ethereum 2.0 scaling solutions, layer-2 integrations, and ecosystem expansion continue to bolster confidence in the asset.
For investors, the recent decline and negative MVRV ratio represent both a risk and an opportunity. While short-term volatility persists, strategic accumulation at these levels may offer favorable long-term entry points. Evaluating Ethereum’s fundamentals alongside market trends and on-chain metrics is essential for informed investment decisions.
Conclusion
Ethereum’s dip below $2,800, coupled with an MVRV of -14.3% and active accumulation trends, reflects a complex but promising market scenario. The interplay of price corrections, investor behavior, and macroeconomic influences highlights both challenges and opportunities. While short-term volatility may persist, on-chain metrics indicate that long-term holders are seizing the dip as an accumulation window, potentially supporting future price stabilization and growth. Monitoring these trends provides investors with actionable insights for navigating Ethereum’s dynamic market environment.
FAQs
Q: How does Ethereum’s MVRV ratio of -14.3% indicate potential buying opportunities?
A negative MVRV ratio of -14.3% suggests that Ethereum’s market value is below the cost basis of many holders, signaling potential undervaluation. This metric often indicates a favorable accumulation window for long-term investors seeking to capitalize on temporary market dips and future price appreciation.
Q: What do accumulation trends reveal about investor confidence in Ethereum?
Accumulation trends show that investors, including long-term holders and institutional participants, are actively purchasing Ethereum during price dips. This behavior reflects confidence in Ethereum’s long-term potential and helps establish support levels that may stabilize the market during periods of volatility.
Q: Why has Ethereum’s price fallen below $2,800 recently?
The recent price decline is influenced by a combination of market volatility, macroeconomic uncertainties, and temporary sell-offs. Investor sentiment, trading behavior, and broader financial market conditions contribute to fluctuations in Ethereum’s price, driving it below key psychological thresholds.
Q: How should traders interpret Ethereum’s accumulation patterns alongside technical indicators?
Traders should analyze accumulation trends in conjunction with technical indicators, such as support levels, moving averages, and volume metrics. Increased accumulation near historical support zones may signal potential stabilization or a price rebound, offering insights into strategic entry points.
Q: What macroeconomic factors are impacting Ethereum’s price movement?
Global economic factors, including interest rate policies, inflation data, and market volatility, indirectly influence Ethereum’s price. Correlations with stock indices, commodity markets, and broader cryptocurrency trends also affect investor behavior and trading patterns, contributing to price fluctuations.